See the options market
like a market maker
Real-time US options flow, smart money positioning, GEX levels, and unusual activity. Lonqua decodes the data that moves markets, in one unified interface, on any device.
No sign-up, no credit card
Our institutional-grade data is provided by ThetaData
See what the market doesn't show you
UOA Signals
Flow Radar analyzes thousands of trades in real-time across the entire US options market to detect abnormal volume on specific contracts. When a contract shows unusually high volume relative to its open interest, it often signals that an institutional player is taking a position. UOA alerts you instantly to these moves so you can analyze them before they show up in the price.
Read our article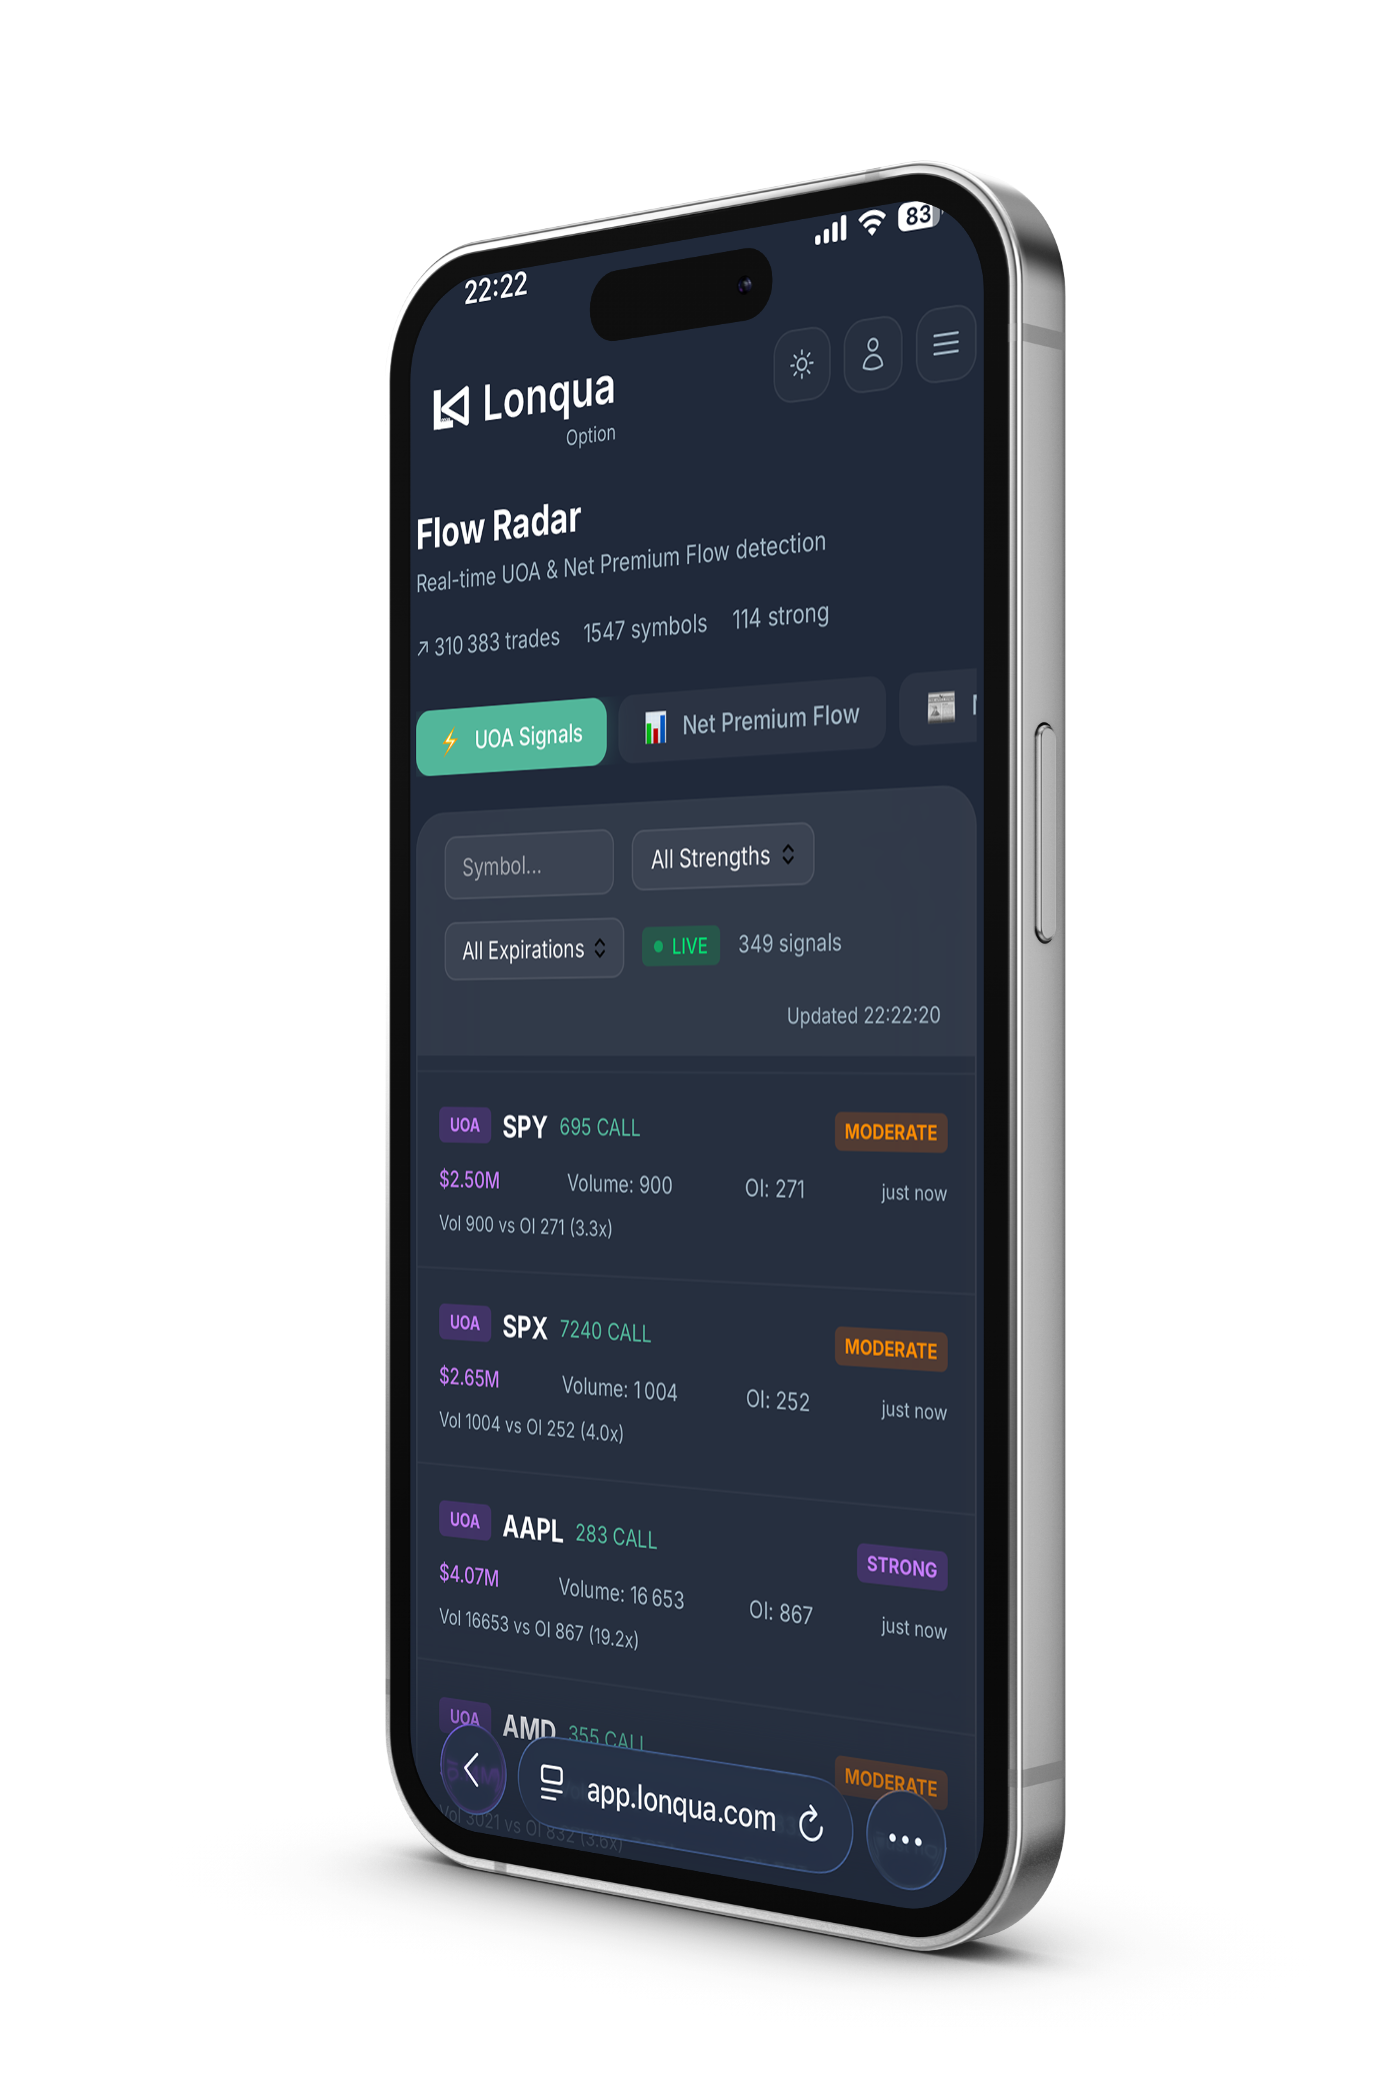
Net Premium Flow
Net Premium Flow (NPF) measures the net directional pressure of the market by aggregating the premium deployed on the bullish side versus the bearish side. It classifies each trade as Bullish (call bought at ask or put sold at bid) or Bearish (put bought at ask or call sold at bid), then computes the net dollar premium difference for each symbol. You can filter by time horizon, from short-term to long-term, to distinguish quick speculative trades from deep institutional conviction plays.
Read our article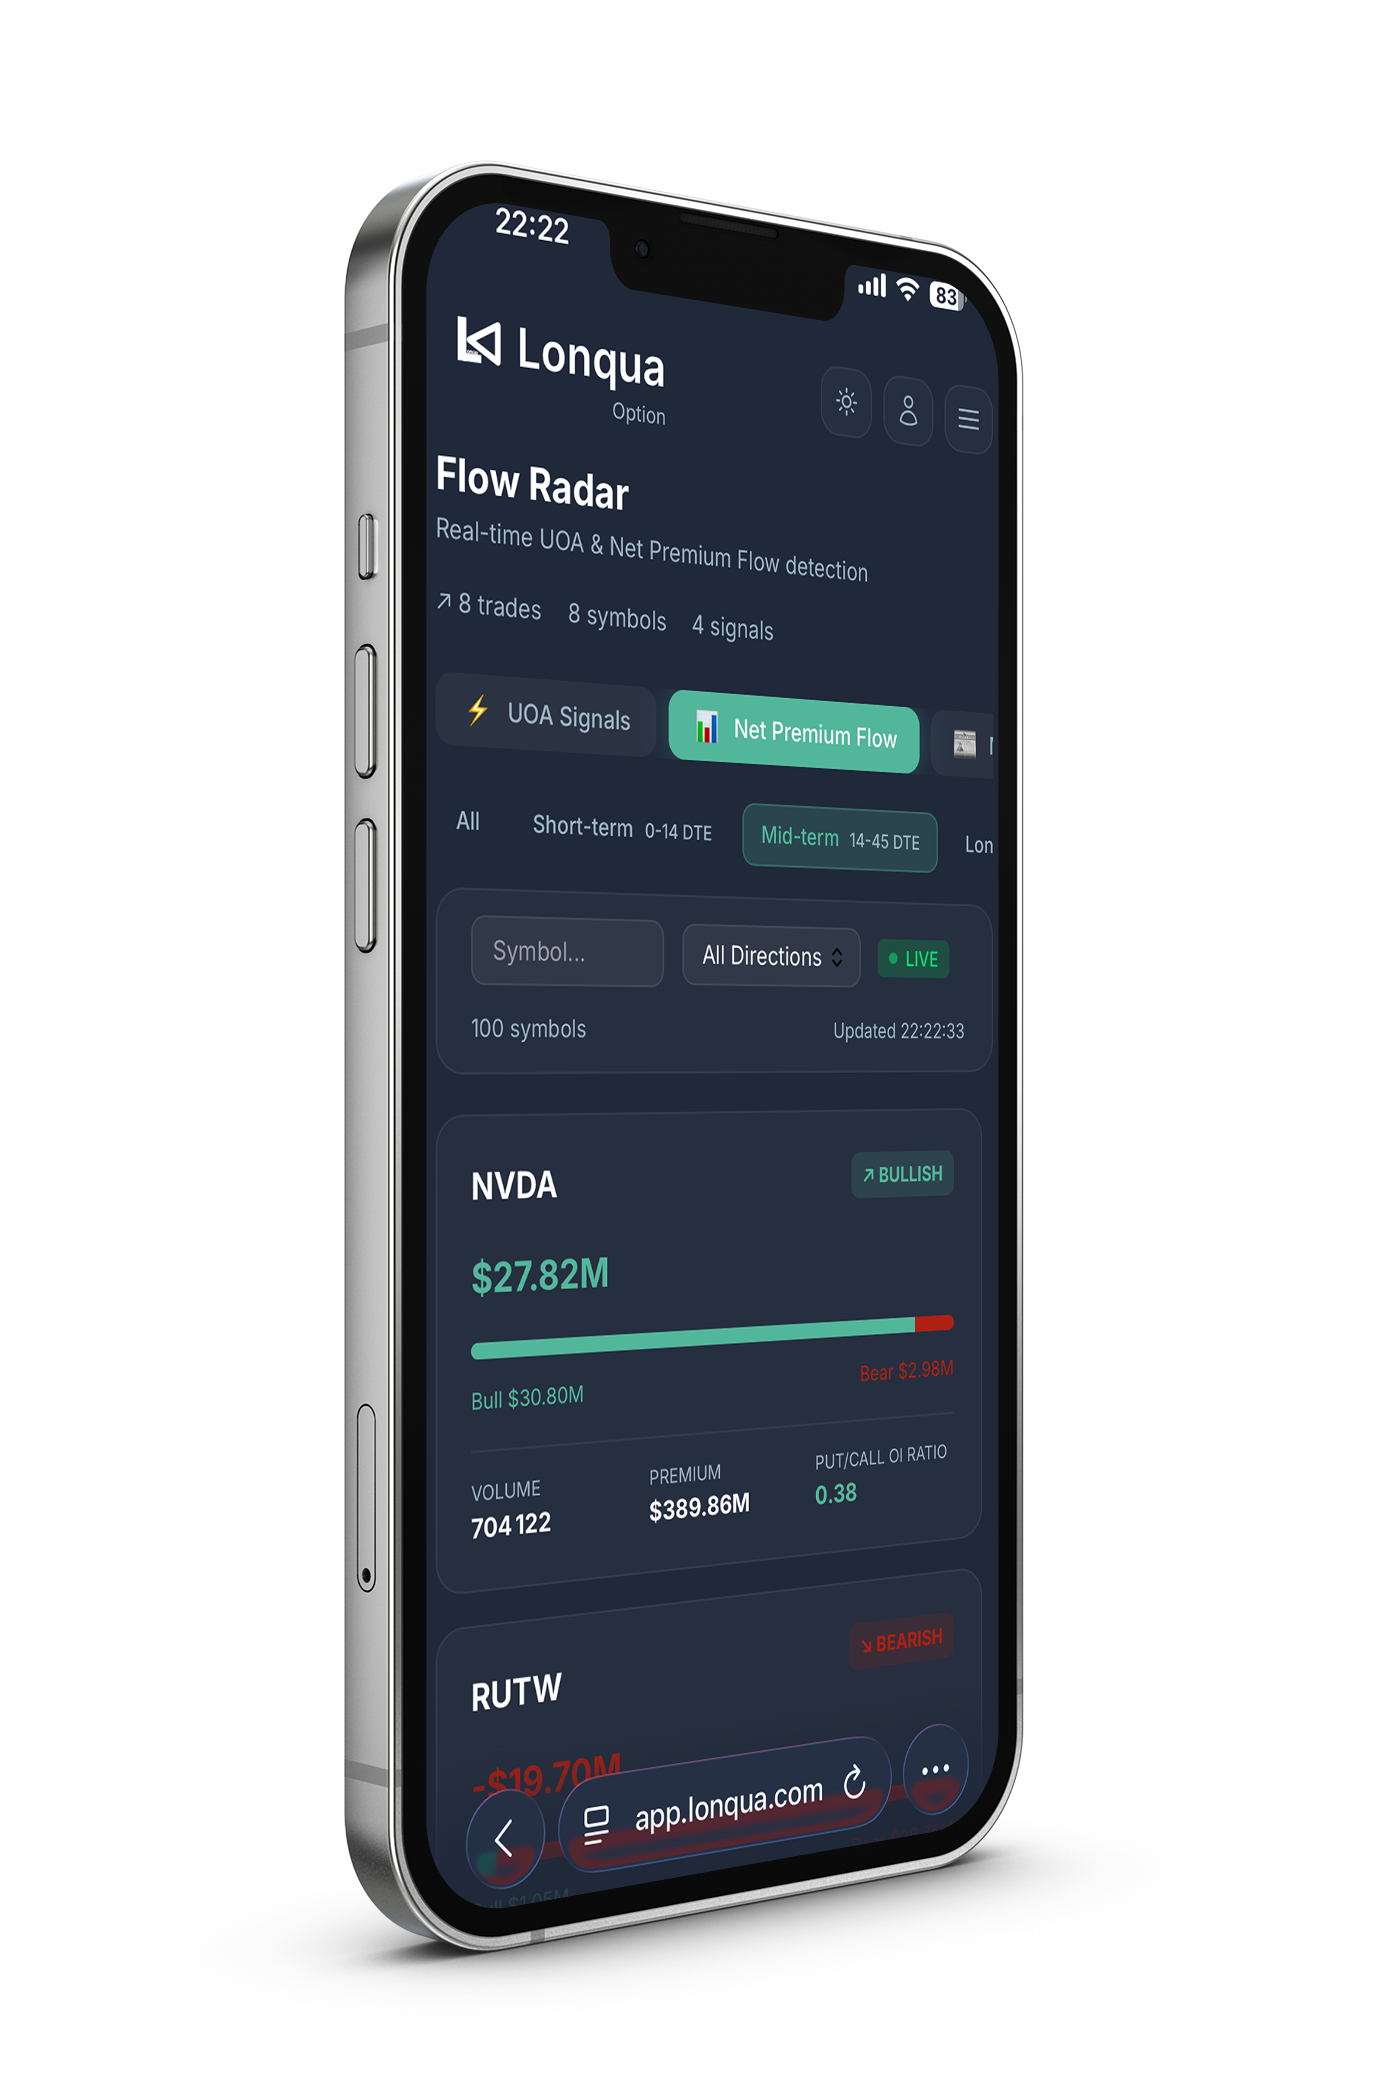
Morning Briefing
Every day before market open, the Morning Briefing generates a complete analysis of your chosen symbol. It combines the current GEX regime, key gamma support and resistance levels, flow indicators, the contango/backwardation regime of the IV term structure and overall sentiment to give you a clear picture of the day's playing field. You start every session with a head start. Reading the term structure reveals in a single second whether the market is in normal mode (contango) or in event mode (backwardation), which directly dictates which options strategies make sense and how vigilant you should be on open positions.
Read our article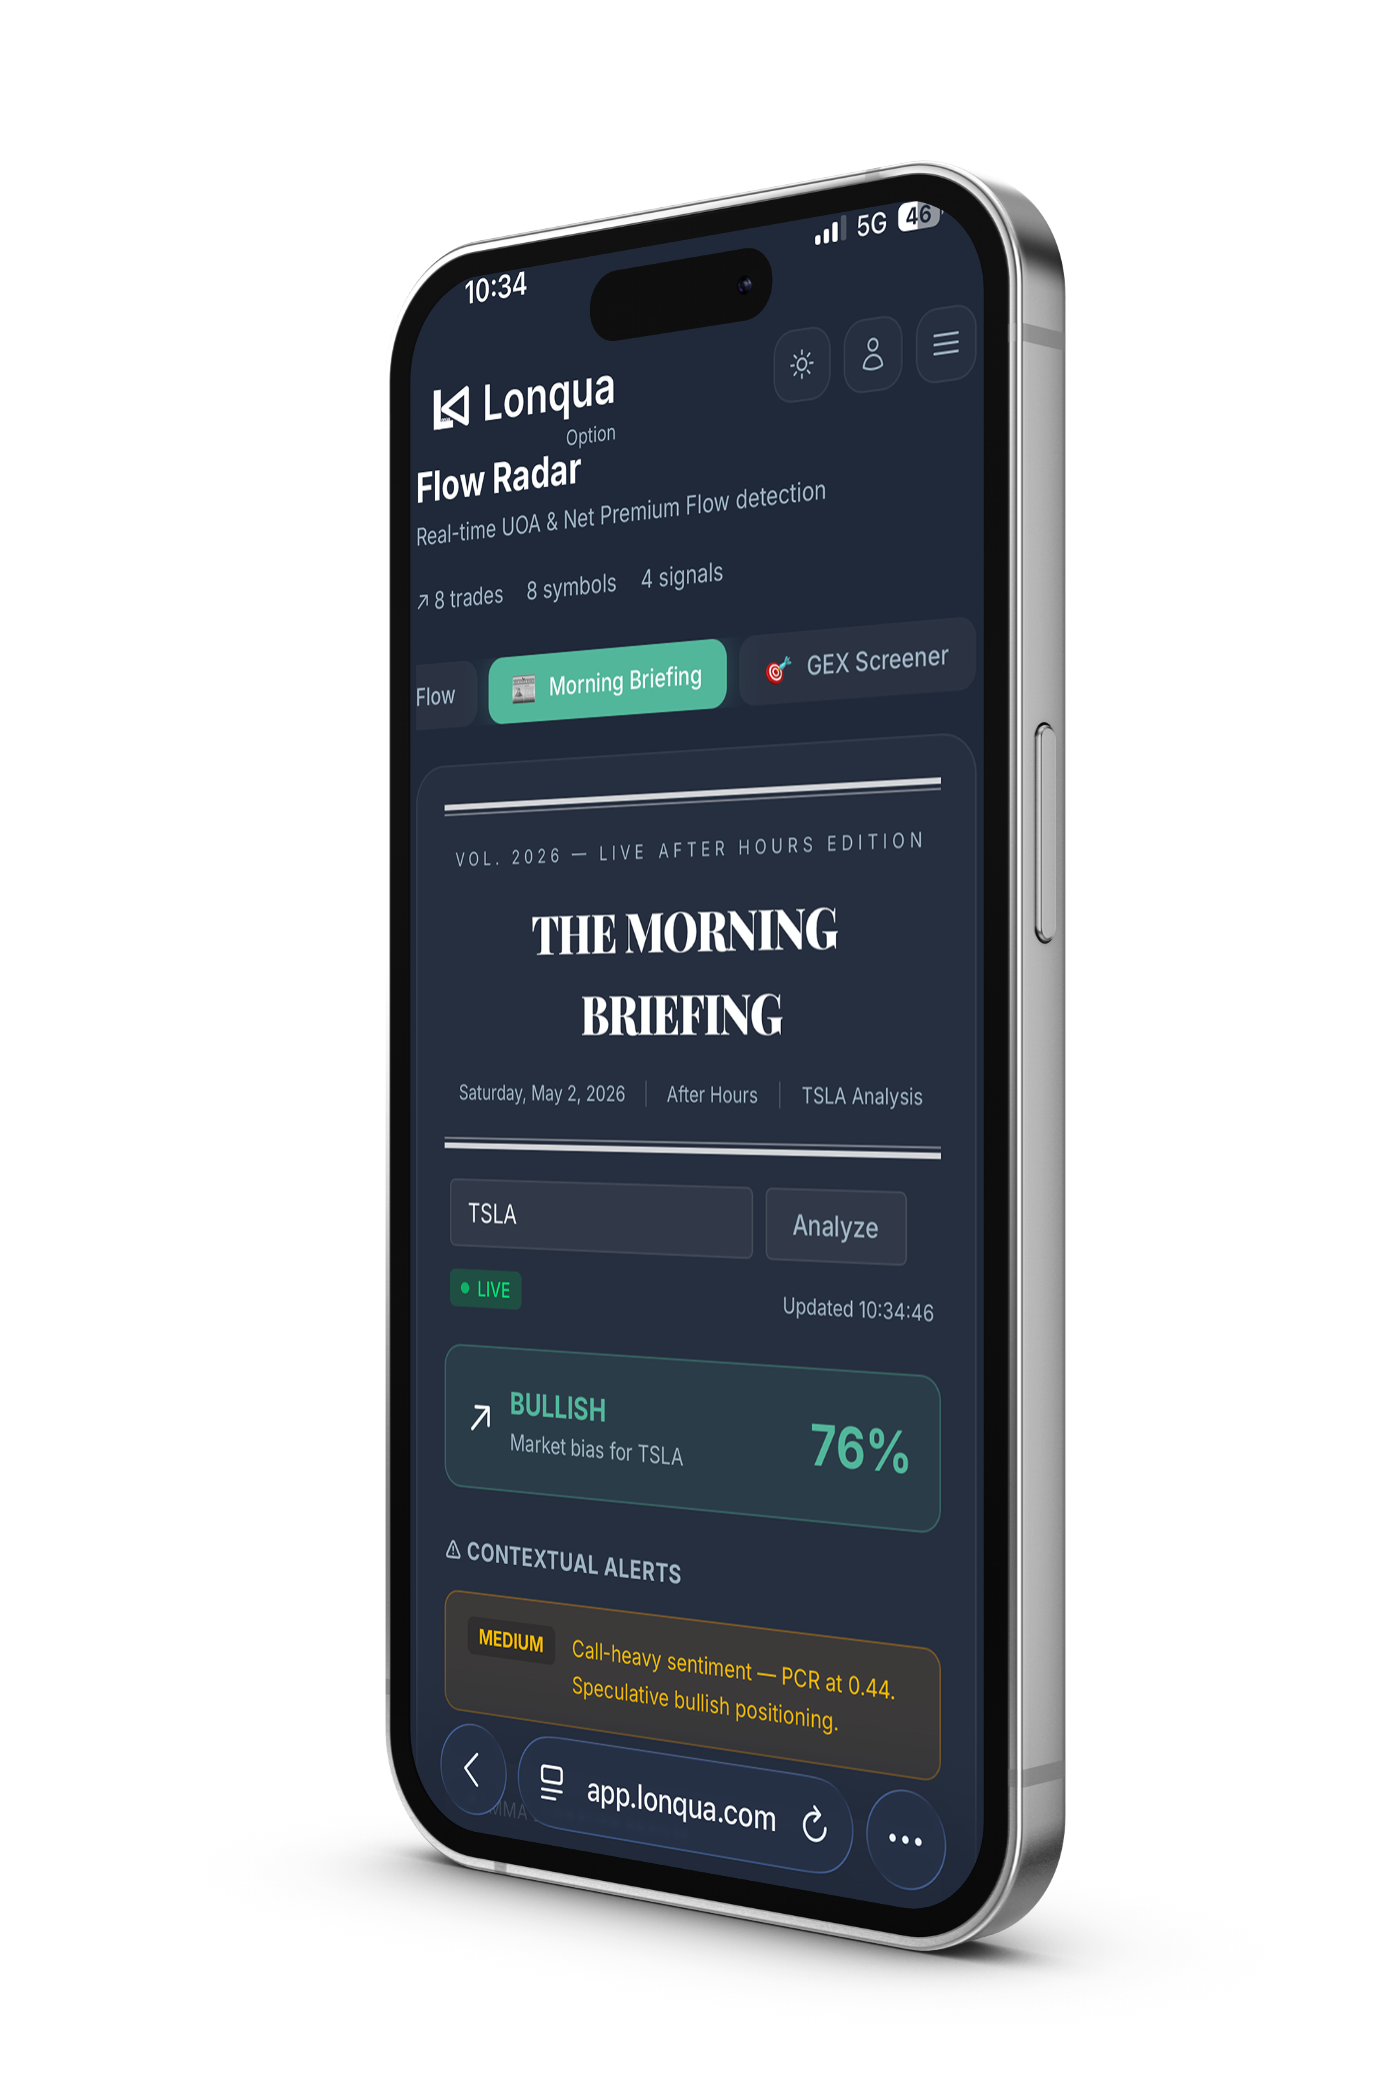
GEX Screener
The GEX Screener scans the entire S&P 500 universe and computes the gamma exposure profile for each symbol on the nearest expiration. It identifies the zones where dealer hedging is most concentrated, defining a floor and ceiling where price tends to gravitate. You see at a glance which stocks are near a reaction zone and which are moving freely.
Read our article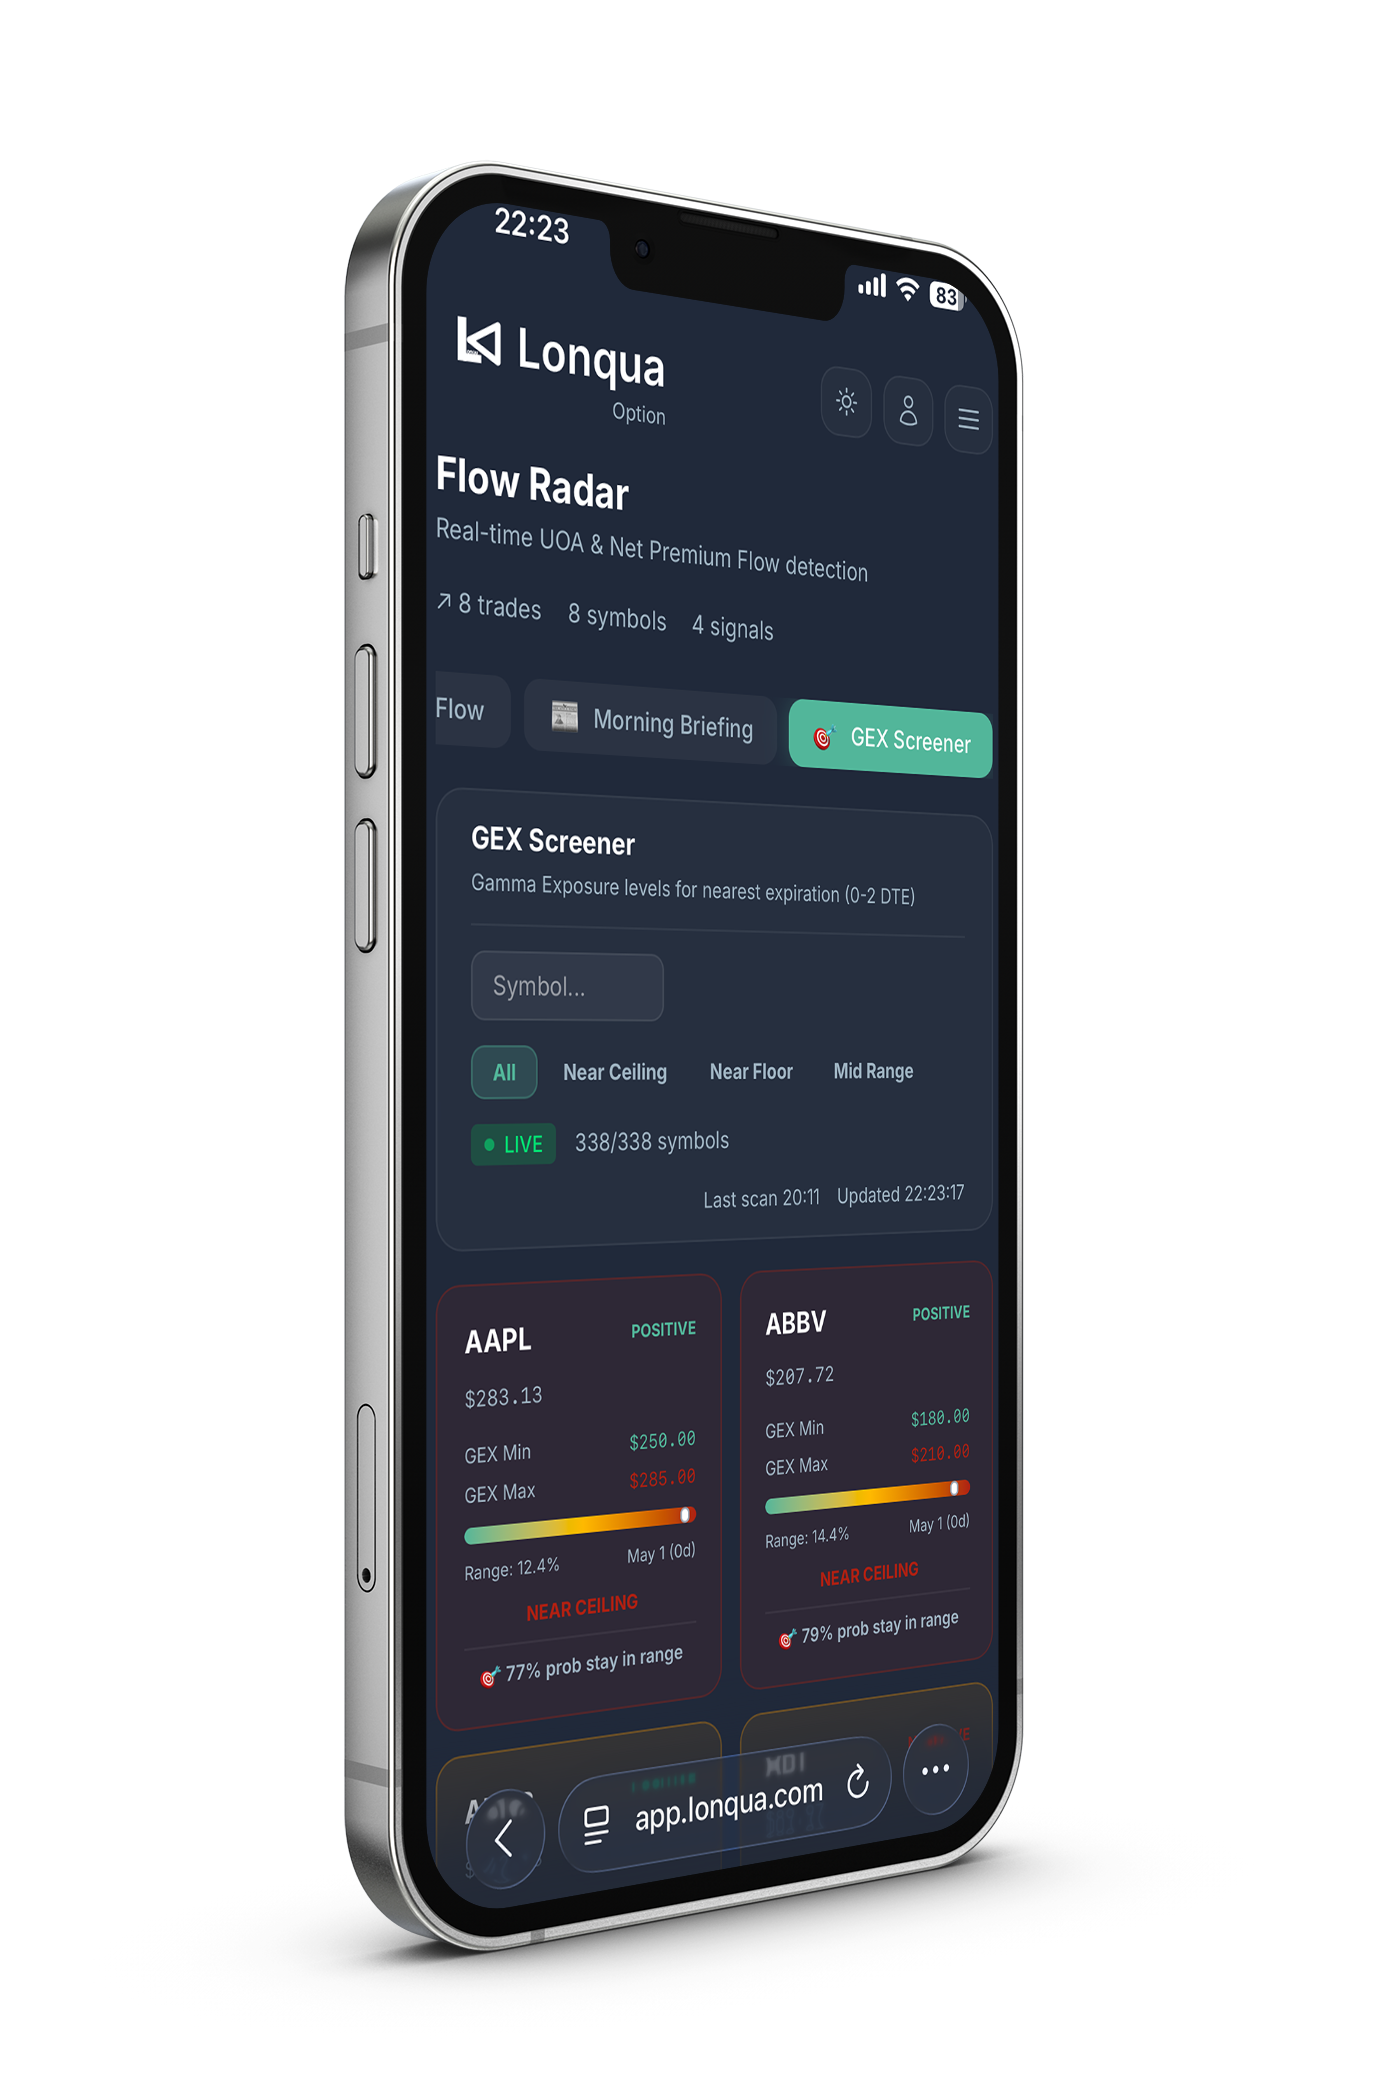
Smart Money
Live Flow
Follow every significant transaction on the US options market in real-time. Live Flow captures orders the moment they are executed, showing the symbol, strike, expiration, premium and strategy type. High-premium transactions are highlighted so you can immediately spot the moves that matter among the thousands of orders flowing every minute.
Insider Flow
Access transactions from executives of publicly traded companies, sourced directly from official SEC Form 4 filings. Every stock purchase, sale or award is displayed with the insider's name, their role in the company and the transaction value. When a CEO is buying heavily into their own stock or a CFO starts selling, you know in real-time.
Congress Flow
Monitor stock transactions from members of the US Congress, sourced from official Senate and House financial disclosures. Every buy and sell is displayed with the member's name, political party, chamber and estimated amount. These officials have access to briefings and information the public doesn't see, and their market moves are now visible on your screen.
Market Sentiment
Market Sentiment aggregates all options flow to rank each symbol by the bullish or bearish pressure observed on the market. On one side the stocks where bullish premiums dominate, on the other those where bearish flow takes over. You instantly see where smart money is positioning and in which direction, with the trade count and total premium volume for each symbol.
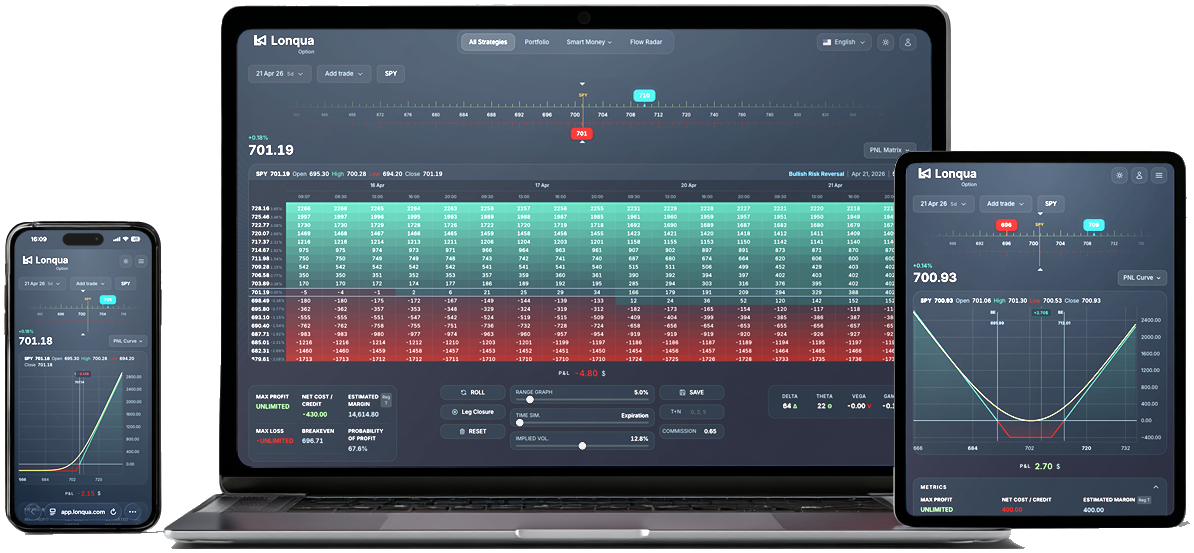
End "Rollover" Stress. Experience Absolute Clarity
Expiration is approaching, and you need to adjust a complex position. This is often when doubt creeps in: "Where do I really stand long-term? Am I about to make an input error on these 4 new legs?"
This lack of visibility and the complexity of the operation generate unnecessary stress and lead to costly mistakes.
Our platform changes the game.
Total Visibility:
Our chart projects the Cumulative P&L of your entire strategy from day one. You see exactly where you stand, without the need for tedious manual bookkeeping.
Execution Simplicity:
Even the most complex strategies (Iron Condors, Calendars, Butterflies...) can be rolled in just a few clicks.
You can now execute your adjustments with peace of mind, confident that you are no longer flying blind.
By the numbers
Lonqua at a glance
A comprehensive platform covering the entire US options market, from institutional flow analysis to strategy simulation.
integrated tools
US Options Exchanges
symbols available in real-time
Your options trading journey starts here
Join the traders who use Lonqua to master US options in a simulation environment designed for everyone
No sign-up, no credit card